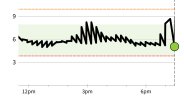
Strange Libre 2 Graph

RoughcutAU

Well-Known Member
Messages
709
I have only used Libre for about 1.5 years but in this time I have never had a graph like the one attached. This sensor is only a few days old but in those days it has been similar graphs. Is the sensor faulty? Or is it possible for that much variability to be natural?

Two contributing factors could be 1. I am experiencing pain in that arm at the moment - not related to the sensor insertion. 2. The attached graph is from a fast from about 7am-7pm so can’t see food being a factor.
IMG_1709977592.993427.jpg
 

Attachments

  • IMG_1709976989.014232.jpg
    IMG_1709976989.014232.jpg
    89.7 KB · Views: 49

Duchess4eva

Member
Messages
17
Type of diabetes
Type 1.5
Treatment type
Insulin
Hi
Im no expert but all I look for in these graphs is that during fasting it stays within range.. yours looks beautiful to me . Im ok with mine despite being out last night and having a couple sneaky cocktails .
IMG_4336.jpg
 

sgm14

Well-Known Member
Messages
193
Or is it possible for that much variability to be natural?

Do you have a finger-prick monitor to confirm?

Not an expert, but I would have thought it would not be normal, otherwise it would mean that someone doing an finger-prick reading would not really have much idea of what their blood sugar really was.

Small variations are normal, but for me the only time I can remember have seen changes by over 3 mmol/l in a 15 minute period have been either after eating, taking insulin, exercising. getting stressed or the false alarms due to a compression low.

As far as I know the reason for the 1 hour warm-up time is that Abbott knows that puncturing your skin to insert the sensor filament causes trauma which can result in unreliable figures, so it is possible that whatever is causing the pain in your arm could be affecting the readings.
 

Melgar

Well-Known Member
Messages
578
Type of diabetes
Other
Treatment type
Tablets (oral)
@RoughcutAU that looks like a dodgy sensor to me even though your graph is in range it looks odd.
 

Jaylee

Oracle
Retired Moderator
Messages
18,232
Type of diabetes
Type 1
Treatment type
Insulin
I have only used Libre for about 1.5 years but in this time I have never had a graph like the one attached. This sensor is only a few days old but in those days it has been similar graphs. Is the sensor faulty? Or is it possible for that much variability to be natural?

Two contributing factors could be 1. I am experiencing pain in that arm at the moment - not related to the sensor insertion. 2. The attached graph is from a fast from about 7am-7pm so can’t see food being a factor.View attachment 66606
I’ve only seen something like this before, but with lower troughs over a 20 minute period whilst sawing wood?
The sensor was on the arm used.. I was also using the xDrip app, but a scan with librelink was similar..

Could you have the sensor probe near muscle tissue?
 
  • Informative
Reactions: Melgar