bennyg70
Well-Known Member
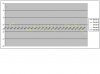
This is my basal profile, according to my first round of testing .. Its literally a join up the dots job as there are a few times missed, and a little inconsistant possibly due to the testing been done on 3 different days..
0 represents my starting point at each test I have done. For example... My evening test I started at 4pm - this was 6mmol and therefore = 0 for the test.
the test at 5pm = 6.2 so represented by +0.2. A 0.2 increase from the starting point in the test... and so on and so forth.
So the middle line is basically the starting point (Whatever that may be) and the shifts up and down would be where my bg headed hour by hour during the test.
I inject my lantus at 10 pm.
I wondered if anyone had any thoughts.
I was surprised as I expected to see quite a rise somewhere between 6pm and 12am possibly when my lantus runs out.. But I wonder if it actually lasts a little longer than the 24 hours causing a double dose overlap and hence a drop around the 11pm mark.
Really appreciate any input.