• Guest, the forum is undergoing some upgrades and so the usual themes will be unavailable for a few days. In the meantime, you can use the forum like normal. We'd love to know what you think about the forum! Take the 2025 Survey »

What is the evidence that the eatwell plate is wrong?

I realise this might be controversial - isn't it all just about losing weight?
Is there anyone here who has a much better self controlled BG level yet has not lost any weight? And I wonder whether the most controlled have also lost the most weight?

The great thing about LCHF is that you feel very satisfied and not hungry and the fat does not make you fat. Then there are VLCD diets. The ones that do not work are the ones where you do not lose weight - aren't they?

I lost two stone (28 pounds) when I switched from low carb (40-60g carbs a day) to very low carb ketogenic eating (less than 30g carbs a day). No portion control, and no calorie counting. It took about 6 months but it happened totally without me trying.

Since then I have been stalled for over 3 years. Yup. Years. Despite intermittent fasting, various periods at different calorie levels, different protein levels, different macro levels, different fluid intakes... I recently went through months of the DietDoctor eating plan, less than 20g carbs a day, actually skipping quite a few of the meals, to make it lower calorie. Still no weight loss. The one constant is the amount of exercise, which is basically steady dog walks. I have joint issues which prevent a lot of the more strenuous stuff. I also have some pretty wacky hormone 'stuff' that means my insulin resistance is high, and I have been obese for most of my adult life - making weight loss more challenging than for most people. The longer you have had it, the harder it sticks.

And in that 3 year weight plateau, my blood glucose control has got better and better. I started off at lowish T2 levels and now I am well below pre-diabetic - all by diet alone. Yet I am still very much obese.

So, in answer to your post, I really don't think it is 'all about weight loss'.
It may be for some people, the ones who lose weight and reverse. A nice simple transition from A to B.
But there are a heck of a lot of us who have other factors at play, where the whole alphabet (from A to Z) plays Scrabble with our bodies, and nothing, but nothing is that simple. :)
That is very interesting - so the improvement over three years with no weight loss.
But you did lose what seems like a good deal of weight in the first instance?
Also - have you any idea whether your body make up has changed? I would be surprised if the exercise you were doing would not mean that slowly but surely fat was being replaced by some muscle which weight twice as much as fat - so could you body composition have changed?

I am not trying to prove a point - I have no idea or any science to draw upon it is just an observation that people with really good control tend to talk about a lot of weight lost at some time. Perhaps when you lose that weight the body starts to recover over time. Who knows.
 
Oh, believe me, 2 stone is not a significant loss overall. I am morbidly obese. have been since I developed a prolactinoma (pituitry gland tumour) in my late teens. Although at one time I weighed 5 stone more than I do now.

And I don't think my dog walks are building muscle. They are the same level of exercise for several years, so any muscle building would have happened 4 years ago.

I think your theory may well be true for a lot of people :) but as always, there are exceptions, and I think those of us who are exceptions may be quite numerous. :)
 
Last edited:
I realise this might be controversial - isn't it all just about losing weight?
Is there anyone here who has a much better self controlled BG level yet has not lost any weight? And I wonder whether the most controlled have also lost the most weight?

The great thing about LCHF is that you feel very satisfied and not hungry and the fat does not make you fat. Then there are VLCD diets. The ones that do not work are the ones where you do not lose weight - aren't they?
ME!!!! I have been low carbing for 20 months now. I have lost only 16 lbs in that time, despite calorie reduction as well as low carbing. But my blood sugar levels are improving all the time. Some of us dont lose weight, or lose it very slowly. I have a BMI of 41 still. So for me, the only thing I can attribute my good blood sugar levels to is the low carbing as i sure as hell havent lost anything like even 10% of my excess weight. There is a whole thread for us who dont lose body fat, despite our miniscule consumption of food.
 
Is there anyone here who has a much better self controlled BG level yet has not lost any weight?

:) there's always exception...I haven't lost any weight since going low carb...but my HbA1c has gone from 11% to 5.5% and stayed there since Dec 2015.

The initial waist loss seems to have come back recently as I indulge in bulletproof coffee...and more dinners. But fasting glucose has held steady around 5.5 mmols.

In fact if you look at the analysis of T2D remission in bariatric surgery, what triggered the interest was that glucose/insulin levels normalized BEFORE any significant weightloss...
https://www.ncbi.nlm.nih.gov/pmc/articles/PMC4566335/
Restrictive procedures resulted in delayed glycemic control related majorly to weight loss however the malabsorptive procedures lead to remission of T2DM very early within days to few weeks after surgery and much before significant weight loss has occurred.
 
I realise this might be controversial - isn't it all just about losing weight?
Is there anyone here who has a much better self controlled BG level yet has not lost any weight? And I wonder whether the most controlled have also lost the most weight?

The great thing about LCHF is that you feel very satisfied and not hungry and the fat does not make you fat. Then there are VLCD diets. The ones that do not work are the ones where you do not lose weight - aren't they?
People can gain weight because of high blood sugars and insulin resistance, leading to diabetes. So the focus needs to be first on reducing blood sugars, which will generally mean you will lose fat. Focusing on losing weight is the wrong way round but it is an easy to measure indicator...
 
Last edited:
:) there's always exception...I haven't lost any weight since going low carb...but my HbA1c has gone from 11% to 5.5% and stayed there since Dec 2015.

The initial waist loss seems to have come back recently as I indulge in bulletproof coffee...and more dinners. But fasting glucose has held steady around 5.5 mmols.

In fact if you look at the analysis of T2D remission in bariatric surgery, what triggered the interest was that glucose/insulin levels normalized BEFORE any significant weightloss...
https://www.ncbi.nlm.nih.gov/pmc/articles/PMC4566335/
Did you mean to say waist loss?? That seems the critical measurement, not weight!
 
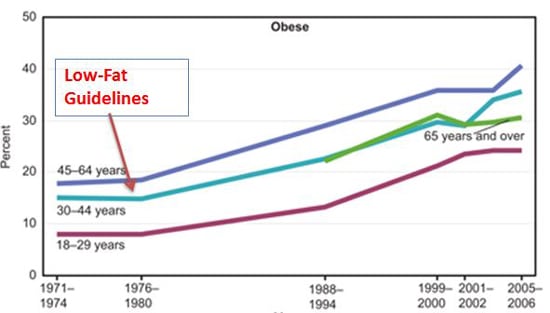
The Eatwell Plate follows on from the Food Pyramid which followed on from the Low Fat diet guidelines of the late 1970s. The UK followed the US dietary guidelines. This has resulted in an increase in obesity and diabetes as the Food Pyramid increased carbs and reduced fats in people's diets.

See the second chart in this website (US stats) ... https://www.healthline.com/nutrition/6-graphs-the-war-on-fat-was-a-mistake#section2

HL128143-graph-2.jpg


The Eatwell Plate has been a total disaster for national health and wellbeing. Increased carbs have led to a dramatic increase in diabetes and dementia as well as causing cancer and heart attacks.
 
I am looking for a weight loss/reducing diet that will work quite fast. The reason being that the ND does not always work for people who have had T2 for more than 4 years. I am doing ND at the moment but although I am nearly at the beginning of week 8 it is obvious that I shall not lose the full 15% of my weight unless I continue it for another 8 weeks or more, or else find a similar weight loss diet that will work faster.I have had T2 symptoms for at least 4 years so I don't want to delay getting liver fat off in case, if I leave it too long,ND or any liver fat loss diet can no longer work because too many beta cells will have died.
As I said in an earlier posting here, if you read the Unwin report carefully , then it includes the following nuggets of interesting info
<<<<In actual fact, the team were surprised that the low carb diet seems to lower NAFLD before the weight loss kicked in, as evidenced by an ultrasound scan perfomed on one patient (n=1) so it seems an LC diet works in parallel to reduce bgl levels, weight loss, and reduce NAFLD. There was no claim made for reversal and the report shows that follow up found that patients who managed to keep their weight off also kept bgl low, but this indicated an element of control, not cure. The report also shows that the lipid markers generally improved even in the presence of higher fat intake which they mention as being reassuring.>>>>

I will also provide the following, which again I have posted in a thread you were monitoring, since you seem to have missed it
https://www.healthline.com/nutrition/23-studies-on-low-carb-and-low-fat-diets#section2
 
I am not overweight but my diabetic nurse kept bringing up diabetic plate when I could not get blood sugars lower. I probably eat smaller portions than the plate illustrates
 
I am not overweight but my diabetic nurse kept bringing up diabetic plate when I could not get blood sugars lower. I probably eat smaller portions than the plate illustrates
Do you feel that Eatwell is helping you? I see you only list an oral med, so have you managed to reduce your bgl now?
 
The Eatwell Plate follows on from the Food Pyramid which followed on from the Low Fat diet guidelines of the late 1970s. The UK followed the US dietary guidelines. This has resulted in an increase in obesity and diabetes as the Food Pyramid increased carbs and reduced fats in people's diets.
What you are saying is not correct - as you could see in the linked documents,calorie consumption is increased while total fat consumption remained the same and increased compared with '70s values
source
https://www.ers.usda.gov/webdocs/publications/42215/5836_aib750g_1_.pdf?v=41055

Nutrient Unit 1970 1994 %change
Food energy Calories 3,300 3,800 15
Carbohydrates Grams 386 491 27
Protein “ 95 110 16
Total fat “ 154 159 3
Saturated fatty
acids “ 54 52 -4
Monounsaturated
fatty acids “ 63 65 2
Polyunsaturated
fatty acids “ 26 31 19
Cholesterol Milligrams 470 410 -13


There are also a lot of statistical data on this site:
https://www.ers.usda.gov/data-products/food-availability-per-capita-data-system/

This .xls file contains a statistic on food trend in the USA, you could clearly see that the mean caloric intake peaked in 2003 with 4200 calories/day with 200 grams of total fat eaten by day that are more than the 147 grams in 1971 for 3300 calories/day.
 
What you are saying is not correct - as you could see in the linked documents,calorie consumption is increased while total fat consumption remained the same and increased compared with '70s values
source
https://www.ers.usda.gov/webdocs/publications/42215/5836_aib750g_1_.pdf?v=41055

Nutrient Unit 1970 1994 %change
Food energy Calories 3,300 3,800 15
Carbohydrates Grams 386 491 27
Protein “ 95 110 16
Total fat “ 154 159 3
Saturated fatty
acids “ 54 52 -4
Monounsaturated
fatty acids “ 63 65 2
Polyunsaturated
fatty acids “ 26 31 19
Cholesterol Milligrams 470 410 -13


There are also a lot of statistical data on this site:
https://www.ers.usda.gov/data-products/food-availability-per-capita-data-system/

This .xls fculled from the national consumption figures, and reflcts actual useile contains a statistic on food trend in the USA, you could clearly see that the mean caloric intake peaked in 2003 with 4200 calories/day with 200 grams of total fat eaten by day that are more than the 147 grams in 1971 for 3300 calories/day.
I think we need to be careful that we compare like for like. The USDA is the US government official site similar to uk.gov in the UK. The link you posted here is statistical data that documents actual consumption by the national body, and is not the same as a set of guidelines that declare what the government would like to see.

I found this link which documents the birth of Myplate, which is the US equivalent to Eatwell.
http://healthland.time.com/2011/06/02/the-usda-ditches-the-food-pyramid-and-offers-a-plate/

This seems to have been dropped in 2015 by the new US guidelines that supercede previous versions that were Myplate based.

https://health.gov/dietaryguidelines/2015/resources/2015-2020_Dietary_Guidelines.pdf

Edit to add: going back to the consumption figures, we must remember that this period was time when there was a major commercial move to replace sat fats like butter by polysunsats (PUFA) in the guise of 'healthy' margarines and those faux butter analogs that spread straight from the fridge. This skewed matters considerably. We can see the drop in Satfat consumption, and the rise in PUFA in those statistics. We also experienced significant uptake of transfats that are not documented in the figures.
 
Last edited:
Ignoring for a moment the "official guidance" and digging into the statistics, it paints an interesting picture. The US has seen a similar uptick in Type 2 to the UK and a far greater increase in obesity. If you look at the overall changes in Macronutrients consumed, you get two interesting parts of the picture.

First up, the overall change in macronutrient make up of diet from 1909 to 2010 is not as big as we might think:

MacroProp.JPG
What this shows is that in 1909, the percentage of Carbs as part of the diet is higher than in the period where we've seen the exponential rise in Type 2.

However, if we look at total consumption, and split that by macronutrient, we see a massive increase in calorie consumption.

total cals.JPG
This shows that the total calorie consumption has increased by some 24%, which is pretty significant. What it also shows is that the increase in calories seems to be proportionally equal between carbs and fats.

There's also a theory that fat makeup has changed and this may have an impact, but if we look at that data, we see the following:
Fat Variation.JPG
The consumption of polyunsaturated fats as a proportion of the calories from fat as roughly doubled compared to saturated fat, and the point at which this increase really starts is around 1950.

If you then go and look at the food group data in the spreadsheet, that also adds an interesting dimension to the discussion, in that we see the change in eating habits starts to also look like it is playing a part. If we look at the difference between 1970 and 2010, we can see that the the largest changes in daily calorie consumption come from fats and oils, a whopping 37% increase, going from 17.8% of daily calories to 22.5%, and a 33% increase in grain products, going from 19.5% to 23.4%. Combined these show that the diet went from containing 37.3% of calories from grain and fat/oil in 1970 to 45.9% in 2010.

Then if we look at the growth rate in Type 2 diabetes we see the following from 1958 to 2015:

diagnosed.JPG
What's notable is the point in the mid-nineties where an acceleration takes place, which doesn't correlate with a significant change to macronutrient mix, but is perhaps more coincident with the the effects of a steadily increasing total amount of calories consumed.

The other factor worth considering is potentially the intake of fructose, and we can potentially use the introduction of High Fructose Corn Syrup as the best allegory of this. The data here is perhaps more interesting. HFCS consumption dramatically increased from 1970.

HFCS.JPG
And what we see here is that the increase in total fructose consumption correlates rather well with the spike in Type 2 diabetes cases that we saw earlier.

I think what all the data goes to show is that Type 2 is more complex than simply "People eat too many carbs" or "People eat too much fat" and is linked to multiple factors, but the correlation with added fructose consumption perhaps shouldn't' be ignored.

Food for thought.
 
Last edited:
Surely the food group mix is the same for everyone? 60% carbohydrate, 30% fat and 10% protein as I recall from my days as an endurance athlete when nutrition was everything. Obviously if you're not exercising then you can reduce the carbs as any excess will be stored as body fat.
 
Ignoring for a moment the "official guidance" and digging into the statistics, it paints an interesting picture. The US has seen a similar uptick in Type 2 to the UK and a far greater increase in obesity. If you look at the overall changes in Macronutrients consumed, you get two interesting parts of the picture.

First up, the overall change in macronutrient make up of diet from 1909 to 2010 is not as big as we might think:

View attachment 24051
What this shows is that in 1909, the percentage of Carbs as part of the diet is higher than in the period where we've seen the exponential rise in Type 2.

However, if we look at total consumption, and split that by macronutrient, we see a massive increase in calorie consumption.

View attachment 24052
This shows that the total calorie consumption has increased by some 24%, which is pretty significant. What it also shows is that the increase in calories seems to be proportionally equal between carbs and fats.

There's also a theory that fat makeup has changed and this may have an impact, but if we look at that data, we see the following:
View attachment 24053
The consumption of polyunsaturated fats as a proportion of the calories from fat as roughly doubled compared to saturated fat, and the point at which this increase really starts is around 1950.

If you then go and look at the food group data in the spreadsheet, that also adds an interesting dimension to the discussion, in that we see the change in eating habits starts to also look like it is playing a part. If we look at the difference between 1970 and 2010, we can see that the the largest changes in daily calorie consumption come from fats and oils, a whopping 37% increase, going from 17.8% of daily calories to 22.5%, and a 33% increase in grain products, going from 19.5% to 23.4%. Combined these show that the diet went from containing 37.3% of calories from grain and fat/oil in 1970 to 45.9% in 2010.

Then if we look at the growth rate in Type 2 diabetes we see the following from 1958 to 2015:

View attachment 24054
What's notable is the point in the mid-nineties where an acceleration takes place, which doesn't correlate with a significant change to macronutrient mix, but is perhaps more coincident with the the effects of a steadily increasing total amount of calories consumed.

The other factor worth considering is potentially the intake of fructose, and we can potentially use the introduction of High Fructose Corn Syrup as the best allegory of this. The data here is perhaps more interesting. HFCS consumption dramatically increased from 1970.

View attachment 24055
And what we see here is that the increase in total fructose consumption correlates rather well with the spike in Type 2 diabetes cases that we saw earlier.

I think what all the data goes to show is that Type 2 is more complex than simply "People eat too many carbs" or "People eat too much fat" and is linked to multiple factors, but the correlation with added fructose consumption perhaps shouldn't' be ignored.

Food for thought.
Thank you Tim for this insight.

I was bought up with food rationing and sugar rationing, I remember as a kid getting one orange from Santa, and this was a rare event. I remember when they first started importing bananas and seeing my first pineapple. Apples and pears were locally grown, but were a seasonal fruit, as were berries. So for 2/3 year we had low fructose intake, and most was canned and expensive.

Now we have fresh(?) tropical fruit all year round, and fructose is freely available (HFCS), and this may be another possibly significant addition to modern diets. I note that the first Macdonalds was in 1953, Although Wimpy preceded it, it was a small venture in US only . It did not go large scale till 1954 as well.
 
Back
Top