- Messages
- 2,170
- Type of diabetes
- Type 2
- Treatment type
- Diet only
Both @bulkbiker @DCUKMod were kind enough to provide blood sugar figures for their OGTT tests using Rapilose that can be bought on the net
http://www.gpsupplies.com/rapilose-ogtt-glucose-solution-300ml-pack-of-1
Kraft did research on various typed of responses to sugar and its predictive effects for diabetes well before any actual diabetes manifest itself. This is yet another test I had not heard of prior to diagnosis and still have not had following diagnosis.
I am going to give myself the test tomorrow and see what happens. In preparation for that have looked at the original Kraft charts, which the Rapilose website then correlates to blood sugar level.
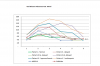
I then created a chart which includes the glucose data provided by @bulkbiker and @DCUKMod and the relevant glucose readings for the types of insuln curves described by Kraft.
I am thinking that using this method, doing the same test annually under the same conditions in terms of prior food content, should give an indication of whether or not one's own insulin responses are getting better or worse. Th relative swings compared to the Kraft curves may well be way higher than the curves show, because of th sheer shock t the system of a sudden flood after so long without.
In any event here is the data for you correlated to the rapilose website interpretation of the Kraft Curves and restated into mmol !
http://www.gpsupplies.com/rapilose-ogtt-glucose-solution-300ml-pack-of-1
Kraft did research on various typed of responses to sugar and its predictive effects for diabetes well before any actual diabetes manifest itself. This is yet another test I had not heard of prior to diagnosis and still have not had following diagnosis.
I am going to give myself the test tomorrow and see what happens. In preparation for that have looked at the original Kraft charts, which the Rapilose website then correlates to blood sugar level.
I then created a chart which includes the glucose data provided by @bulkbiker and @DCUKMod and the relevant glucose readings for the types of insuln curves described by Kraft.
I am thinking that using this method, doing the same test annually under the same conditions in terms of prior food content, should give an indication of whether or not one's own insulin responses are getting better or worse. Th relative swings compared to the Kraft curves may well be way higher than the curves show, because of th sheer shock t the system of a sudden flood after so long without.
In any event here is the data for you correlated to the rapilose website interpretation of the Kraft Curves and restated into mmol !