Anyone care to have a look at this graph and share their thoughts?
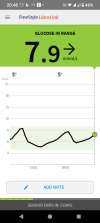
It shows my blood sugar levels rising before I have taken my lunch.
Then it shows it rising from around 4pm which again is before my 5.30 dinner.
Then it starts rising again at around 7pm.
I have noticed this pattern fairly often over the last few months and can't understand it,
My first thought was my levels start to rise when the boluses for the meals wears off and would suggest that my basal dosage is too low. But I have been woken up with low warnings during the night almost every night which would suggest my basal dosage is too high.
The figures are not too bad, but from past experience when things like this start happening, they usually get steadily worse and I would like to prevent that happening.