• Guest - w'd love to know what you think about the forum! Take the 2026 Survey »

Showing a fairly solid 2-week pattern

Mdub

Member
Messages
17
Type of diabetes
Treatment type
Tablets (oral)
Dislikes
Negativity
Bear in mind, I was putting up an 11.3 HbA1c back in September of this year. My labs earlier this month showed a 6.4, clearly much improved. This is today's number set, this pattern is probably pretty solid for at least 2-3 weeks. Impressions? Thoughts? Thank you:
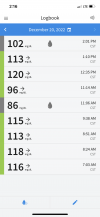
image0.png
 
Bear in mind, I was putting up an 11.3 HbA1c back in September of this year. My labs earlier this month showed a 6.4, clearly much improved.
Well done, that's an anazing improvement!
This is today's number set, this pattern is probably pretty solid for at least 2-3 weeks. Impressions? Thoughts? Thank you:
The graphs are much more informative for seeing patterns than the logbook feature.
What do the daily trends and/or daily graph look like?

As for the numbers shown here, they look pretty much non diabetic with the fasting one (assuming the earliest was fasting) a tad higher than non diabetic. Fasting blood glucose is often the last one to come down.
 
I have been trying to pay attention to TIR and the Daily Patterns. From my limited understanding, TIR is actually getting promoted above hbA1c in many circles as a better indication of control. The Daily Patterns metric has helped me tweak my diet/exercise plan because I have identified some odd spikes at certain times of the day. For example, my BG seems to rise steadily prandial or not, between the hours of 8-10 a.m. That pattern seems to have diminished some, at least over the last few weeks. So, overall, the CGM has benefited me tremendously so far.
 
Back
Top