
- Messages
- 709
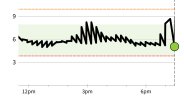
I have only used Libre for about 1.5 years but in this time I have never had a graph like the one attached. This sensor is only a few days old but in those days it has been similar graphs. Is the sensor faulty? Or is it possible for that much variability to be natural?
Two contributing factors could be 1. I am experiencing pain in that arm at the moment - not related to the sensor insertion. 2. The attached graph is from a fast from about 7am-7pm so can’t see food being a factor.

Two contributing factors could be 1. I am experiencing pain in that arm at the moment - not related to the sensor insertion. 2. The attached graph is from a fast from about 7am-7pm so can’t see food being a factor.


 . Im ok with mine despite being out last night and having a couple sneaky cocktails
  .
.
