-
Guest - w'd love to know what you think about the forum! Take the 2025 Survey »
You are using an out of date browser. It may not display this or other websites correctly.
You should upgrade or use an alternative browser.
You should upgrade or use an alternative browser.
Time in range
- Thread starter SueJB
- Start Date
Ushthetaff
Well-Known Member
- Messages
- 1,142
- Location
- Scotland
- Type of diabetes
- Type 1
- Treatment type
- Insulin
- Dislikes
- Mountain out of mole hill makers ,queues , crowds , shopping on a Saturday hmm just shopping I guess no matter what day it is
Personally 70% or more
As high as I can,anything above 70% is recommended I think. Mines normally around 80-85 and I'm happy with thatJust interested in what you aim for when looking at time in range for your sensor?
I aim for as high as I can get it.
Jasmin2000
Well-Known Member
- Messages
- 184
- Type of diabetes
- Type 1
- Treatment type
- Insulin
I've rather left TIR as a metric as it's quoted (by my practice nurse) too often without any reference to variance (CV) and often in the absence of an average BG. So you can have a 100% TIR with all your readings at 7 mmol/L or 100% TIR with half at 4 and half at 10 and these are very different pictures. There is a %CV in LIbreview, so I go there if I'm interested.
However, time out of range is worse in that you can have 20% time out of range (TOR) with all readings at 3.8 or 20% TOR with all at 2.5 - massively different and Libreview doesn't have any algorithms to put these differences in a picture. It needs a TOR x BG (i.e. an area under the curve) function to be useful. Not sure if any of the other tools have this - anyone?.
However, time out of range is worse in that you can have 20% time out of range (TOR) with all readings at 3.8 or 20% TOR with all at 2.5 - massively different and Libreview doesn't have any algorithms to put these differences in a picture. It needs a TOR x BG (i.e. an area under the curve) function to be useful. Not sure if any of the other tools have this - anyone?.
Last edited:
SueJB
Well-Known Member
My mind bogglesI've rather left TIR as a metric as it's quoted (by my practice nurse) too often without any reference to variance (CV) and often in the absence of an average BG. So you can have a 100% TIR with all your readings at 7 mmol/L or 100% TIR with half at 4 and half at 10 and these are very different pictures. There is a %CV in LIbreview, so I go there if I'm interested.
However, time out of range is worse in that you can have 20% time out of range (TOR) with all readings at 3.8 or 20% TOR with all at 2.5 - massively different and Libreview doesn't have any algorithms to put these differences in a picture. It needs a TOR x BG (i.e. an area under the curve) function to be useful. Not sure if any of the other tools have this - anyone?.
CheeseSeaker
Well-Known Member
- Messages
- 223
- Location
- Nottingham
- Type of diabetes
- Type 1
- Treatment type
- Pump
- Dislikes
- People arguing over silly stuff
As high as possible (I'm happy when in the 90%-100%) as I've done a lot of work to get there (Fully Closed Loop which should handle most of lives events without my chimpanzee (me) messing with anything and screwing it all up).
Currently running at 91% for the last 7 days - been impacted by post-Covid recovery so hopefully I can do better this week.
Currently running at 91% for the last 7 days - been impacted by post-Covid recovery so hopefully I can do better this week.
D
Deleted member 527103
Guest
The recommendation is 70% in range with less than 5% below 4.0.
I do not aim for "as high as possible" because I aim to look after my mental health as well as my diabetes. For me 100% in range would require an obsessive dedication to my diabetes which is not healthy for me.
I usually achieve around 85%.
And my target is between 4.0 and 10.0 on a pump without HCL.
- Messages
- 2,703
- Location
- Harpenden, Herts, England
- Type of diabetes
- Treatment type
- Diet only
- Dislikes
- exercise, phone calls
From X (or Twitter as I still call it): (link: https://x.com/AKoutnik/status/1797636130281787396)
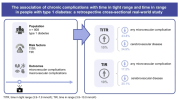
Would more time in tight range (70-140mg/dL) versus time in range (70-180mg/dL) be associated with fewer complications? https://link.springer.com/article/10.1007/s00125-024-06171-y…
New data say: YES. New data suggests an observational link between time in tight range (70-140mg/dL; TITR) and time in range (70-180mg/dL; TIR) with microvascular and macrovascular complications.
No surprise: 10% improvement in TITR was associated with larger reductions in micro- and macrovascular complications than a 10% improvement in TIR. This data supports the dose-dependent impact of CGM glycemic metrics on complications (better glycemic control is superior) and also provides more evidence for CGMs association with complications.
@parthaskar
@TBattelino
@MCRiddell1
@MichaelMindrum
@BeyondType1
@JimJohnsonSci

My aded note TITR is 3.9 to 7.8mmol/L versus standard TIR3.9 to 10mmol/L
Would more time in tight range (70-140mg/dL) versus time in range (70-180mg/dL) be associated with fewer complications? https://link.springer.com/article/10.1007/s00125-024-06171-y…
New data say: YES. New data suggests an observational link between time in tight range (70-140mg/dL; TITR) and time in range (70-180mg/dL; TIR) with microvascular and macrovascular complications.
No surprise: 10% improvement in TITR was associated with larger reductions in micro- and macrovascular complications than a 10% improvement in TIR. This data supports the dose-dependent impact of CGM glycemic metrics on complications (better glycemic control is superior) and also provides more evidence for CGMs association with complications.
@parthaskar
@TBattelino
@MCRiddell1
@MichaelMindrum
@BeyondType1
@JimJohnsonSci

My aded note TITR is 3.9 to 7.8mmol/L versus standard TIR3.9 to 10mmol/L
I don't particularly aim for anything, I know the recommendation is over 70% and I usually sit around 75%-85% but I try not to worry about it overly too much. As long as I know I'm not having too many big highs/lows. I'm on HCL so most of the work is done for me anyway and I don't need to think about it but even so I don't constantly monitor my blood sugar to make sure I am perfectly in range.
Zhnyaka
Well-Known Member
- Messages
- 845
- Type of diabetes
- Type 1
- Treatment type
- Insulin
- Dislikes
- Homophobia, racism, sexism
JemQuijano43
Newbie
- Messages
- 3
- Type of diabetes
- Type 1
- Treatment type
- Insulin
24% in range . Between 10.0 and 4.5 mmol/l
73% higher then 10.0 mmol/l
3% below 4.5 mmol/l
73% higher then 10.0 mmol/l
3% below 4.5 mmol/l
eventhorizon
Well-Known Member
- Messages
- 529
- Type of diabetes
- Type 1
- Treatment type
- Insulin
I'm happy with around 80% TIR with less than 1% below 3.9.

