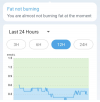
You and me both! From the graph though, my amateur interpretation of the graph data would be that you stayed 8 or under the entire time, were back to within roughly 1-2 mmol of your starting BG after around 2 hours, then were back to your starting BG or below after around 3 hours. While the rise from approx 4 to 8 would qualify as a spike in my book at least, if my interpretation is in the ball park then your body's response was reasonably good.Thanks, Paul. It seemed a bit scary to me. After my normal food of steak, salmon and chicken, with mushrooms and green veg, the graphs hardly went up, so I was very surprised to see such a spike. I'm still quite new to the diabetes club, and even newer to the CGM club. I still have things to learn.
Could be reading it wrong, hopefully one of those more experienced with CGM graphs will correct me if I am.


