• Guest - w'd love to know what you think about the forum! Take the 2025 Survey »

HbA1c calculator

Grazer

Well-Known Member
Messages
3,115
Hi all,
Don't wish to bore you all (well, I probably will anyway), but I wanted to experiment with posting a picture.
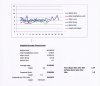
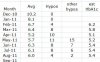
The picture which (hopefully!) follows is my HbA1c calculator. The graph is the blood tests I've taken in the last 5 months. Underneath, the "average blood sugars" aren't straight averages but are calculated with a 30 something character equation allowing for my blood responses, areas under curves of BG rises, timing of peaks, etc. A further calc then turns it into a running HbA1c figure for myself. It's updated automatically every time I add a new reading. The last time I was tested (March 16th 2011) my calculator said I'd be 5.54 and I was actually 5.9, so not bad. My BG's are more consistent now, so I think my next test will be closer to my "calculated" one on my sheet as the assumptions used will be more reliable (currently suggesting 5.28 - let's hope!) The sheet also converts into the new IFCC units automatically. You have to drag the side bar down to see the predicted figures.I'd be interested in what you think of it.
Malc
 

Attachments

  • HbA1c Calculator.jpg
    HbA1c Calculator.jpg
    152.4 KB · Views: 2,107
I think it's really clever but after a day of reading complicated social science papers my brain's a bit dead... not sure I understand exactly what it's doing. Is the calculation making a 'true' HbA1c rather than an average? you know what I mean - a real life hba1c actually is slightly weighted towards the last week or so, so if you ran an average of 4.5 for 5 weeks and then suddenly 10.5 for the last week, the average would be 5.5 but the hba1c would be much higher than that coz of the recent-bg-bias.

if it is making a 'true' hba1c, what is your thinking behind that? Wouldn't you want a real average, a straightforward one, in order to understand your bg?

Reading this back, I'm not sure I even understand my own question here...
 
Snodger said:
Reading this back, I'm not sure I even understand my own question here...
Love it Snodger! Not sure I understand your question either. But there again I seldom understand myself!
It doesn't allow for the later weeks having a greater impact than the earlier ones, but as my levels are pretty constant it doesn't matter. The figure I show as "weighted average" is my true average BG during the testing period of the graph, allowing for the amounts of time that each reading effects me for. For example, I know that my BG during the night is pretty steady so the average of fasting and bedtime BGs is a figure that effects my averages for about 8 hours. The fluctuations in the day with different meals require more complicated assumptions but not too difficult. I know that my sugars peak on average 45 mins before my 2 hour post prandial tests and are then 15% higher on average. I know it takes an average of 3 hours for my sugars to get right back to a base level of about 6 in the afternoon/evening, but lower in the morning, and so on.
End result is that at any one moment my "calculator" predicts the HbA1c test results I would get if I went to the clinic at that time and had a proper test. It's just a way of encouraging myself as I see a string of good tests bring my HbA1c prediction down. It also helps me to see the effect of any "bad" figures as the sheet updates and I can see the effect on the HbA1c. As I said, it seems pretty accurate, with the march 16th prediction being pretty close to the real thing, and probably within the limits of accuracy of my meter.
Malc
 
then I am very impressed and ever so slightly scared :shock:
I'm just waiting now for you to take over the world....
 
FWIW, I do the same thing. I put all my results into a spreadsheet, and calculate daily, weekly and monthly averages. I then use the avg+2.52 /1.583 formula with my monthly average to give me an estimated HbA1c. I use a weighting of 70:20:10 for the last three months. Looking back, this model gave me the same result as my last clinic appointment, so it seems reasonably accurate. I also calculate a standard deviation from my results and use -1stdev to +1stdev to give me a range. Any results outside that range are then anomalous. the closer the top and bottom lines are together, the narrower my spread of blood results, i.e. the tighter the control. My control was really tight in April (too tight) and I've loosened it a bit but also had a couple of infections since then, giving some bulges in my results.

Excel does almost all of the work for you. I thought everyone did this :wink:
 

Attachments

  • graph2.jpg
    graph2.jpg
    39.9 KB · Views: 1,982
  • table.JPG
    table.JPG
    29.6 KB · Views: 1,967
Snodger said:
then I am very impressed and ever so slightly scared
I'm just waiting now for you to take over the world....
Can't do that until next wednesday I'm afraid
Malc :lol:
 
Wow :shock:
Well done you for working all that out 8)

I downloaded a free record keeping program which also draws all sorts of graphs and predicts the A1c for any time period, 1 day, 1 week, 2 weeks, 1 month, 2 months etc
I have found it to be quite accurate so far, only 0.1 out on my daughters actual HbA1c at the hospital.
I think i will stick to that as i don't fancy trying to work it out how you lot have :oops: :lol:
 
Tell us more about this bit:
malcysykes1 said:
Underneath, the "average blood sugars" aren't straight averages but are calculated with a 30 something character equation allowing for my blood responses, areas under curves of BG rises, timing of peaks, etc.

I have a spreadsheet similar to RussG's, but I just do a straight integration under the curve. Are you testing enough to pick up all of the post prandial peaks or are you approximating them in your big equation.

Everytime I go to America, I come back with a bag full of A1CNow kits, so these days I find it easier to test myself once a month, than caculating using my spreadsheet.

Diabetes is a great disease for those of us who are engineers or have an analytical bent. In the very early days being able to measure my own progress was very reassuring.
 
borofergie said:
Are you testing enough to pick up all of the post prandial peaks or are you approximating them in your big equation.
I don't test all the time, but I test often enough so my peaks are representative of the meals I eat - I'm boring and tend to be fairly repetitive with my meals! So I can then average the peaks by mealtime type (Breakfast, lunch and dinner) and each set of averages will be near enough for calc purposes.
Malc
 
Hi Borofergie,

Yes I was interested in that bit of Malc's post as well. I test quite a lot as I've been having some issues with hypos and variable basal levels. I just put my preprandial readings into my spreadsheet but will check back against my meter average to compare averages.

So far I've found it to be reasonably close, and certainly close enough to use for trend information. I don't find my response post meal to be that predictable, even for exactly the same breakfast so haven't bothered trying to factor something in that simulates this in the average readings. By the time I've estimated an HbA1c, it's been through enough averaging stages that I'm not sure how much value it would add IMO. I'm probably more interested in seeing a reduction in mean over time, coupled with variation / standard deviation. If those numbers are going in the right direction, then I figure the Hb will be as well.
 
Back
Top