Hi All,
I have posted this in the RH (Reactive Hypoglycaemia) forum, because i think it might be interesting to fellow RHers. No idea if it will be of any interest to anyone else!")
I got the Libre on Monday (early xmas pressie to self). I am thinking that the wee graphs are going to be fantastically motivating over xmas.
In case anyone doesn't know, the Libre is a widget that sticks to your arm and reads the glucose level in the interstitial fluid under the skin. For me, as an unmedicated T2, it is less about the numbers and more about the peaks, troughs and the speed of the highs and lows, allowing me to understand the effect my current eating has, and how to tweak it in future.
I consider myself well controlled (by very low carb/usually ketogenic diet) and until i saw these graphs, i thought my RH was virtually a thing of the past. Turns out, even as a T2, it is still going strong.
Screenshots and comments to follow.")
Day 1
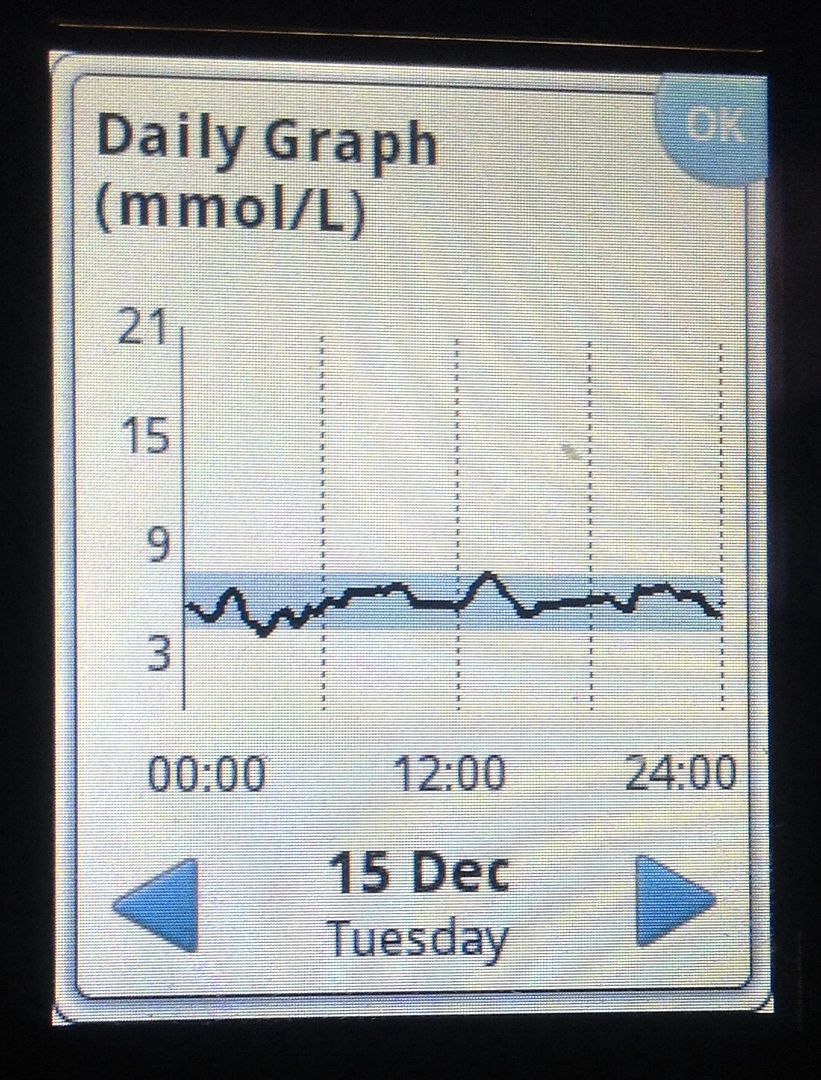
The blue zone is my self-selected target range. I have chosen 4.5-7.5 for my range.
Note the low point at 2am? And the subsequent rise?
That is a 'low' of around 4mmol/l it isn't a hypo, but it did trigger a liver dump (the rise) that takes me up to over 6mmol/l and jiggles around, up and down for the rest of the night.
As you will see, a variation of this happens nearly every night.
The gentler curves between 6am and midday are due to a coffeencream for breakfast followed by a 9bar
The hump at 1pm is from hummus, eaten as lunch, with a teasp.
The lower carb supper 7pm onwards, had protein and green veg. So v slow release carbs
Lesson for the day:
All readings were in my target zone
But the carbs in the 9bar and the hummus definitely resulted in lower bg at the end than at the start.
= Very mild RH reaction.
If i had eaten more carbs, the RH reaction would have been bigger.
I have posted this in the RH (Reactive Hypoglycaemia) forum, because i think it might be interesting to fellow RHers. No idea if it will be of any interest to anyone else!
I got the Libre on Monday (early xmas pressie to self). I am thinking that the wee graphs are going to be fantastically motivating over xmas.
In case anyone doesn't know, the Libre is a widget that sticks to your arm and reads the glucose level in the interstitial fluid under the skin. For me, as an unmedicated T2, it is less about the numbers and more about the peaks, troughs and the speed of the highs and lows, allowing me to understand the effect my current eating has, and how to tweak it in future.
I consider myself well controlled (by very low carb/usually ketogenic diet) and until i saw these graphs, i thought my RH was virtually a thing of the past. Turns out, even as a T2, it is still going strong.
Screenshots and comments to follow.
Day 1

The blue zone is my self-selected target range. I have chosen 4.5-7.5 for my range.
Note the low point at 2am? And the subsequent rise?
That is a 'low' of around 4mmol/l it isn't a hypo, but it did trigger a liver dump (the rise) that takes me up to over 6mmol/l and jiggles around, up and down for the rest of the night.
As you will see, a variation of this happens nearly every night.
The gentler curves between 6am and midday are due to a coffeencream for breakfast followed by a 9bar
The hump at 1pm is from hummus, eaten as lunch, with a teasp.
The lower carb supper 7pm onwards, had protein and green veg. So v slow release carbs
Lesson for the day:
All readings were in my target zone
But the carbs in the 9bar and the hummus definitely resulted in lower bg at the end than at the start.
= Very mild RH reaction.
If i had eaten more carbs, the RH reaction would have been bigger.
Last edited by a moderator:


