_Steve_
Well-Known Member
Still getting used to this Libre2 gizmo. Find some of the readings interesting for want of a better word. It is helpful insomuch as it gives a 24 hr reading minute by minute. I am not sure why on a daily graph it shows for instance going from 5 at midnight to over 11 at 4am when I had not eaten anything
later than 9pm the previous evening. Then by 5.30am down to 6 but back up to 9 at 6.30am. There seems to be lots of ups and downs with no attributable reasons. I have been trying out various foodstuffs to see if any give a noticeable rise. I know that both pasta and chocolate are frowned upon but in my case both seem to have a very limited effect in raising bg value. A pint , or two, of beer does have an effect but soon subsides. It is giving me an estimated A1c of 34mmol/mol which is way lower than my surgery gave me. Though in their defence the Libre2 figure is only over some 10 days and not 3 months.
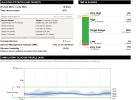
I believe the A1C estimate will get more accurate as it has more data to base the algorithm on. It’s also worth noting you can use libreview.com to view a more detailed, in depth look at your stats.
Personally I love statistics and numbers, so libreview is a must for me. It also shows the GMI as opposed to the estimated A1C that the app shows. If you’re logging carbs/eating or exercise in the LibreLink app it’ll overlay it on top of hourly graphs so you can easily see spikes and trends.