Hi
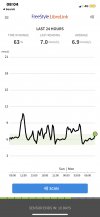
@Grace30666 , are you asking whether those graphs indicate insulin resistance? Looks like you have two very brief spikes over 10 but otherwise (to me, and I'm biased because I'm an insulin using T1) they look very good.
Here's a link that may help - it shows what happened when a group of non diabetics wore cgms for 10 days...
Use of continuous glucose monitoring (CGM) is increasing for insulin-requiring patients with diabetes. Although data on glycemic profiles of healthy, nondiabetic individuals exist for older sensors, assessment of glycemic metrics with new-generation ...

www.ncbi.nlm.nih.gov
And I'm curious, what have you set your range as? (If it was 4 to 10, which is common for T1s) then you'd be at nearly 100% so am guessing it must be much tighter.)
But I freely admit that I my knowledge of MODY (other than it being genetic and common in families with lots of diabetics) is very limited,so not sure how relevant my observations are.