CherryAA
Well-Known Member
- Messages
- 2,170
- Type of diabetes
- Type 2
- Treatment type
- Diet only
I've been puzzling at this for a while - i.e. when did I become insulin resistant and why did no-one test me for it.
It turns out they do - the figures are available just that for some godforsaken reason they don't actually calculate it from the data available and they don't tell us about it.
There is another formula to calculate insulin resistance .
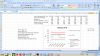
The formula is : log normal of (your fasting blood glucose x your triglycerides ) *2
eg sample calc
LOW
MG/DL
Fasting Blood Glucose 68.4
Fasting Trigs 39.88
=(FBG x FT)/2 1,364
LN function - Log Normal 7.22
The log normal function is available in xl or I assume any phone system with some maths.
Glucose converter
http://unitslab.com/node/1
TRIGS converter
http://unitslab.com/node/53
There is then a "normal range " which takes on the characteristics of the normal population range 7.22 to 9.3
and a cut off point above which you either already are, or are likely to become diabetic
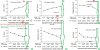
I have my fasting blood glucose and my triglycerides numbers going back to 1995.
Sure enough calculated this way it shows I became diabetic in 2014 and it should have been spotted then - which I already knew.
It also shows the steady track back to normality since adopting LCHF. see the attached chart which covers 1995- 2017 for me .
So it seems that if you still have those old blood tests, you can see for yourself when it all started to go wrong and how long you were insulin resistant before diagnosis and indeed how insulin resistant you are now.
It also means that it is pretty easy to find out if anyone else is either diabetic or likely to become so, just based on two bits of data in a normal health check.
http://www.diagnosisdiet.com/wp-content/uploads/2017/06/insulin-resistance-tests-rev-3-15-17.pdf
WHO KNEW !!!
It turns out they do - the figures are available just that for some godforsaken reason they don't actually calculate it from the data available and they don't tell us about it.
There is another formula to calculate insulin resistance .
The formula is : log normal of (your fasting blood glucose x your triglycerides ) *2
eg sample calc
LOW
MG/DL
Fasting Blood Glucose 68.4
Fasting Trigs 39.88
=(FBG x FT)/2 1,364
LN function - Log Normal 7.22
The log normal function is available in xl or I assume any phone system with some maths.
Glucose converter
http://unitslab.com/node/1
TRIGS converter
http://unitslab.com/node/53
There is then a "normal range " which takes on the characteristics of the normal population range 7.22 to 9.3
and a cut off point above which you either already are, or are likely to become diabetic
I have my fasting blood glucose and my triglycerides numbers going back to 1995.
Sure enough calculated this way it shows I became diabetic in 2014 and it should have been spotted then - which I already knew.
It also shows the steady track back to normality since adopting LCHF. see the attached chart which covers 1995- 2017 for me .
So it seems that if you still have those old blood tests, you can see for yourself when it all started to go wrong and how long you were insulin resistant before diagnosis and indeed how insulin resistant you are now.
It also means that it is pretty easy to find out if anyone else is either diabetic or likely to become so, just based on two bits of data in a normal health check.
http://www.diagnosisdiet.com/wp-content/uploads/2017/06/insulin-resistance-tests-rev-3-15-17.pdf
WHO KNEW !!!
Attachments

Last edited:
")