Begonia
Well-Known Member
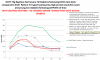
I've seen lots of graphs showing 'normal' response to meals etc., but just wondering how much variation in BG a non-diabetic person would see throughout a 24 hour period. For example:
Does the BG level run lower throughout the night and by how much
What happens during the 'waking up' and getting moving period
What happens during various levels of exercise (any change going for a walk vs major session in gym)
How much change would be seen with 'stress' (eg during a major presentation or even just a busy period)
I suspect this would vary a lot between people, but does anyone have any examples ?
")