Ok, let me try and do some maths (that’s a big ask for my old small brain by the way!)..
Firstly, looks at these stats

So, take the 50-59 group...
- Symptomatic cases requiring hospital treatment 10.2%
- Those of that 10.2% who require critical care 12.2%
- Dying 0.6%
These are only based on cases admitted to hospital and they will only usually be tested at that stage...There will be many more thousands of cases with just mild symptoms who have not been tested or hospitalised. So, I’d suggest the real % of all CV cases ending up hospitalised, critical or dying is much much lower.
So let’s say as a metric that these numbers are based on 1000, that’s 6 people dying.
Assuming then there’s at least 3 times as many cases unreported/untested, then those 6 people dying drives that 0.6% significantly downward...to 0.2% of total cases....if more than 3000 (and it almost certainly is!)...THEN THE ACTUAL FIGURE IS CLOSER TO SEASONAL FLU
Forgive me if my maths are dodgy, I am no expert, and this is of course opinion and I humbly stand to be corrected. But this gives me some peace of mind as a well controlled type 1 with no other known issues.
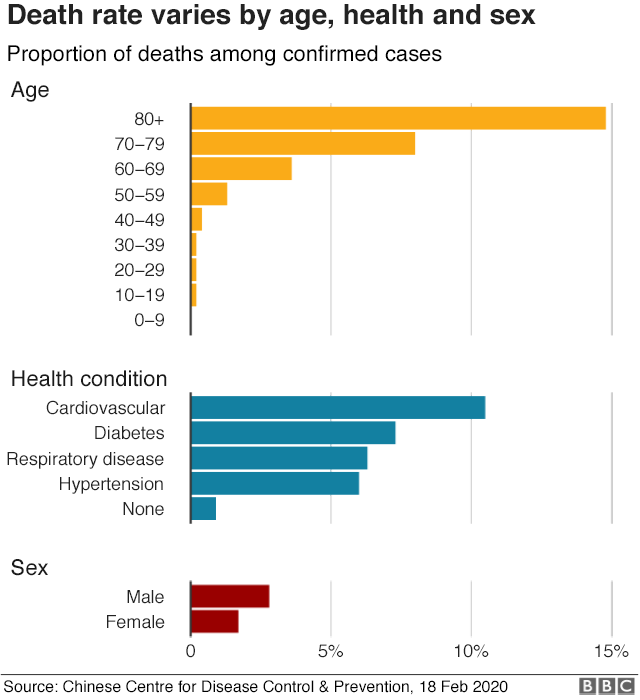
Though it would be great if us Diabetics could have some more specific stats for our own group...in other words, % hospitalised and deaths among known cases with diabetes...(inc type, level of control and comorbidities, etc...I get that’s a big ask though).